TK4
Well-known member
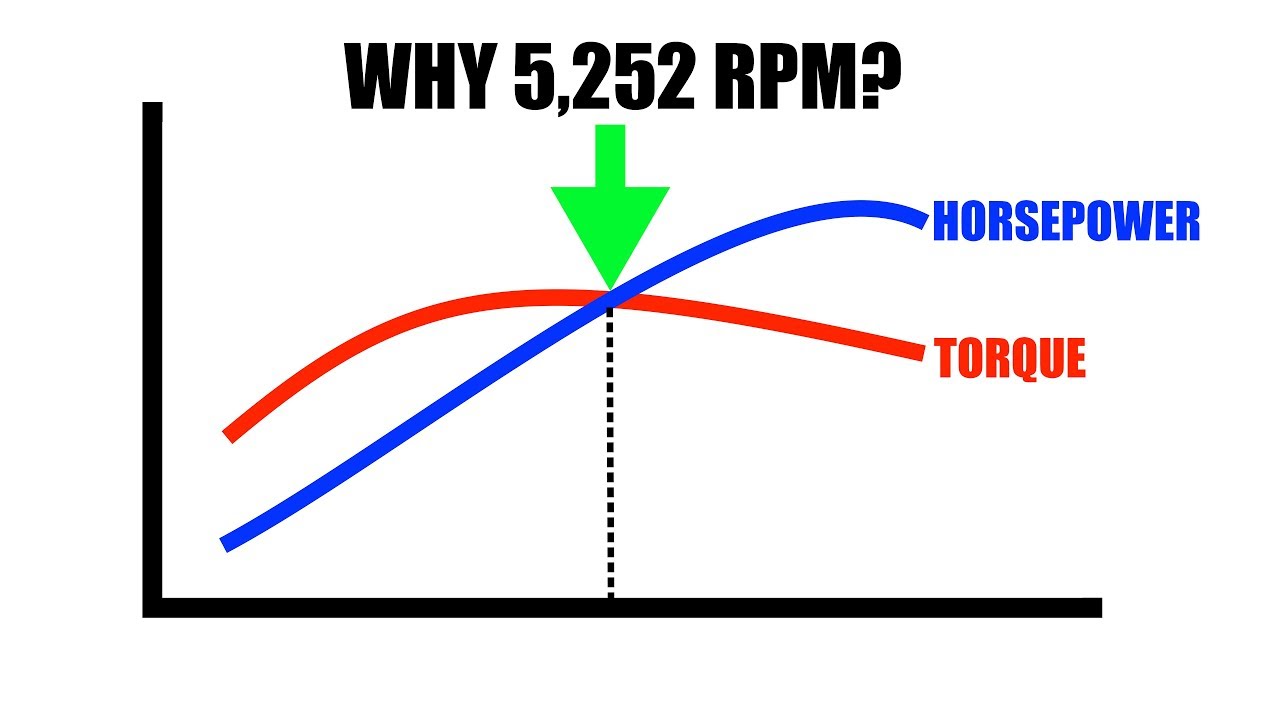
Kevin Cameron nails it again - A Torque Curve for Every Purpose
Having the biggest swingin' dick on the dyno may not be what you really need.
Having the biggest swingin' dick on the dyno may not be what you really need.